Experience the Smart O&M Portal
Everything you need to monitor, analyze, and cure your solar portfolio
Platform Capabilities
Portfolio Dashboard
Portfolio Dashboard
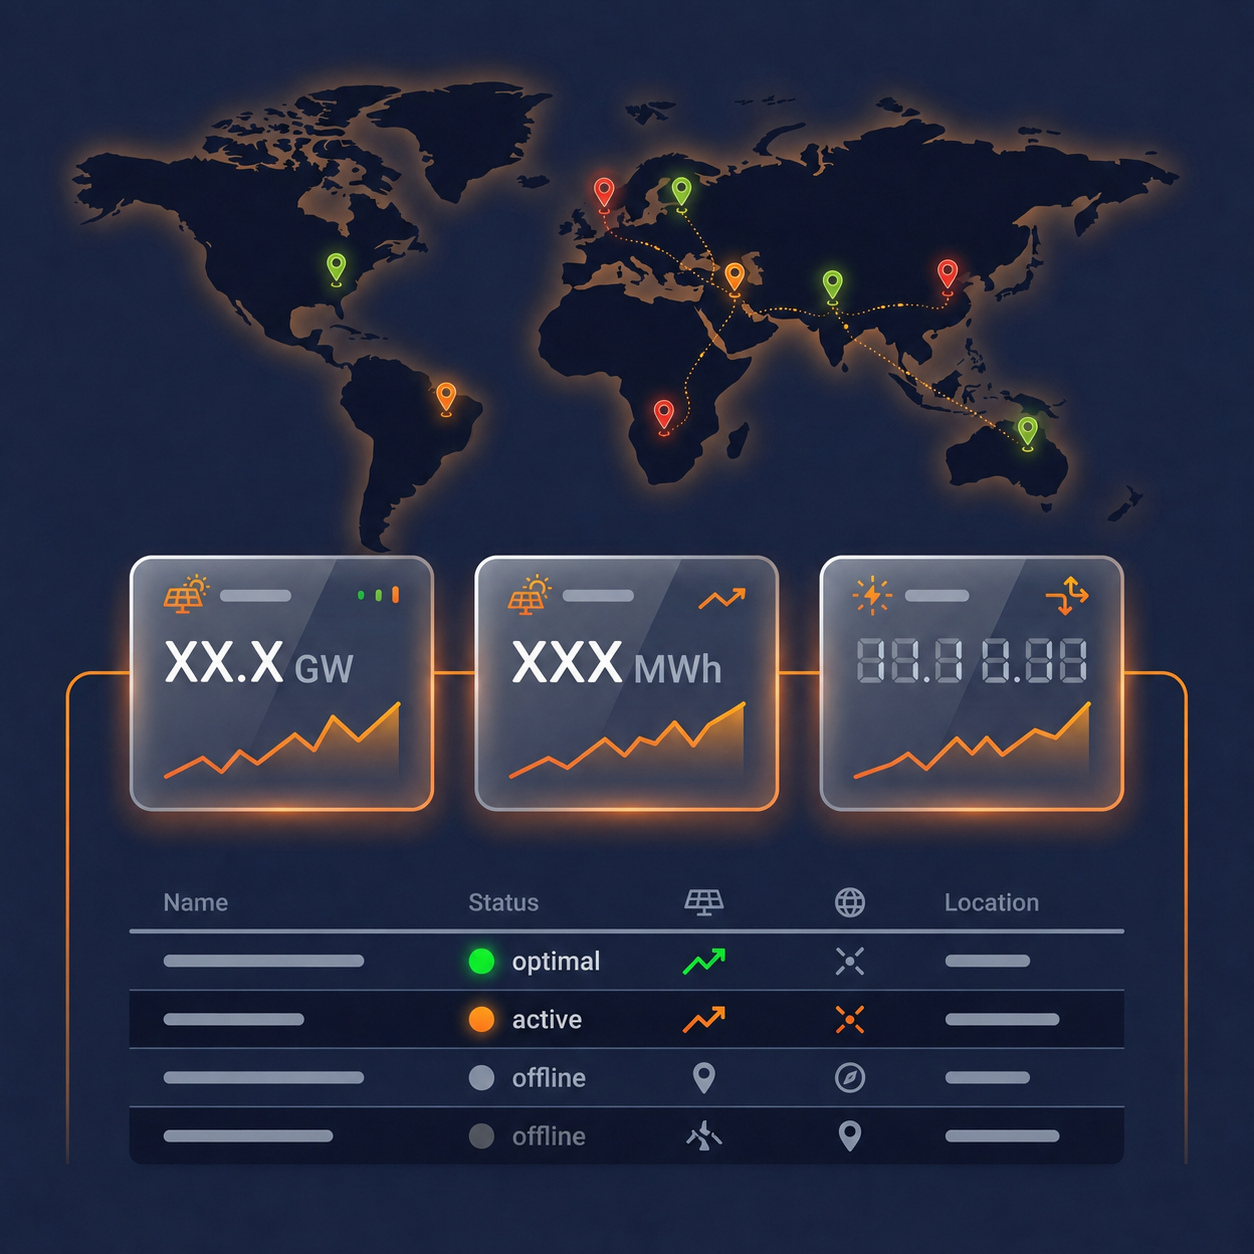
A live, interactive world map of every asset in your portfolio, with real-time status indicators.
- Monitor live site status across all geographies
- View system performance at a glance
- Control access for multiple clients securely
Real-Time Monitoring & Alerts
Real-Time Monitoring & Alerts
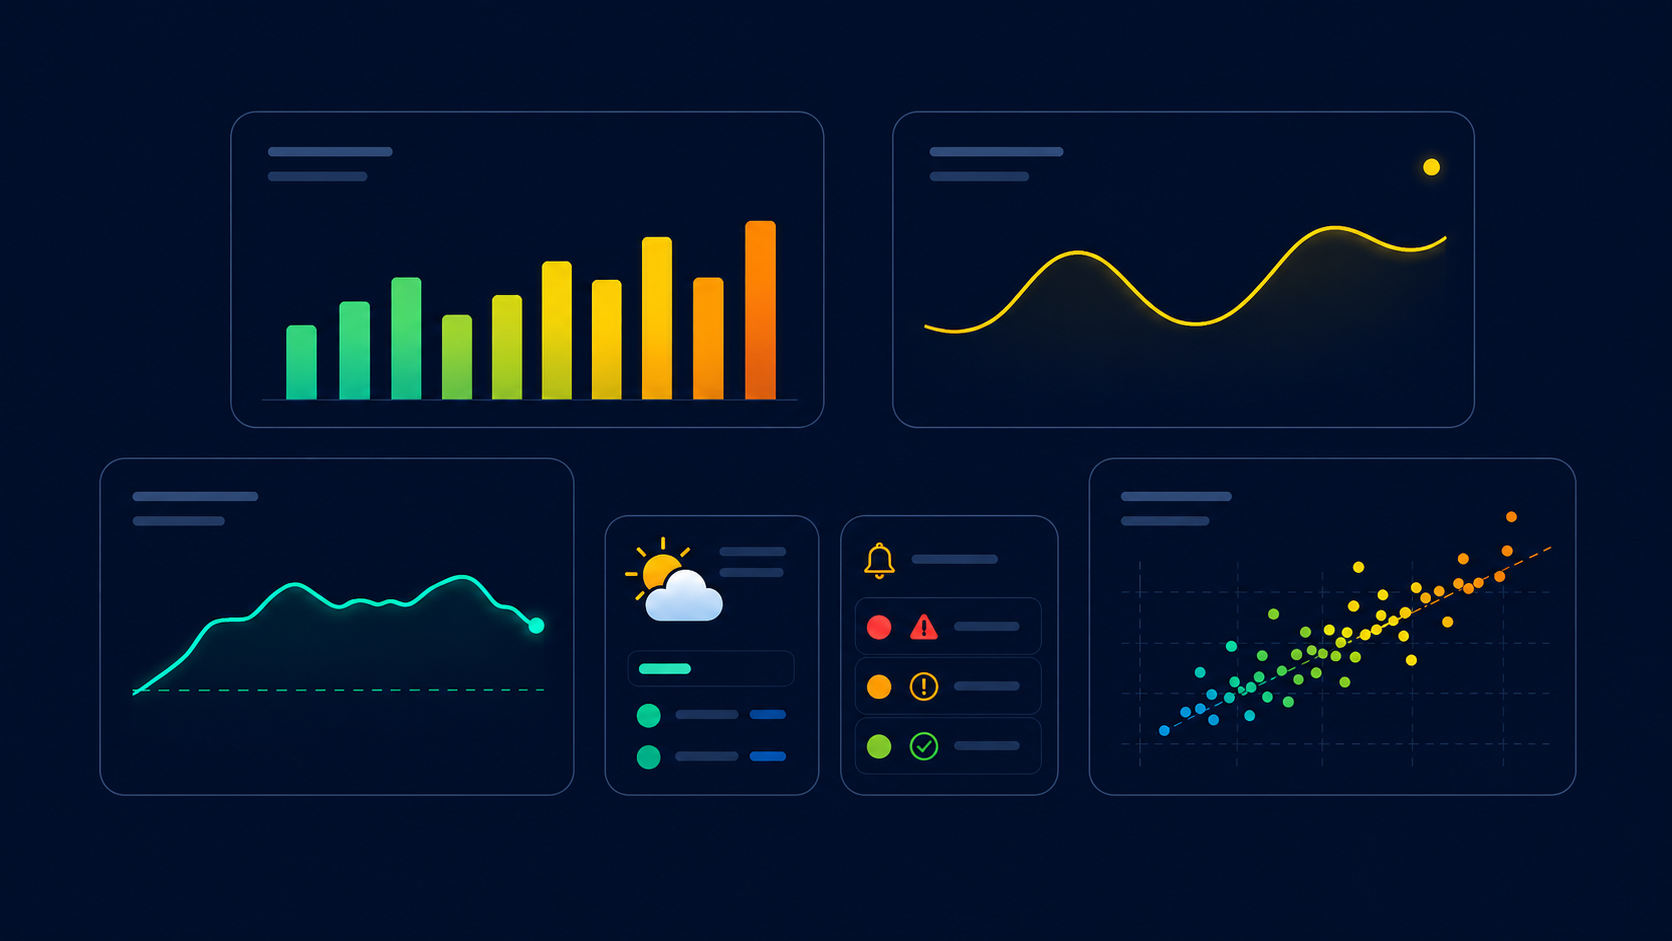
Granular, device-level monitoring with interactive charts - generation, irradiation, and PR scatter plots.
- Receive real-time performance alerts
- Track live weather alongside performance data
- Analyse yield vs. irradiation scatter plots
- Customise date ranges for any view
PV Healthscan
PV Healthscan
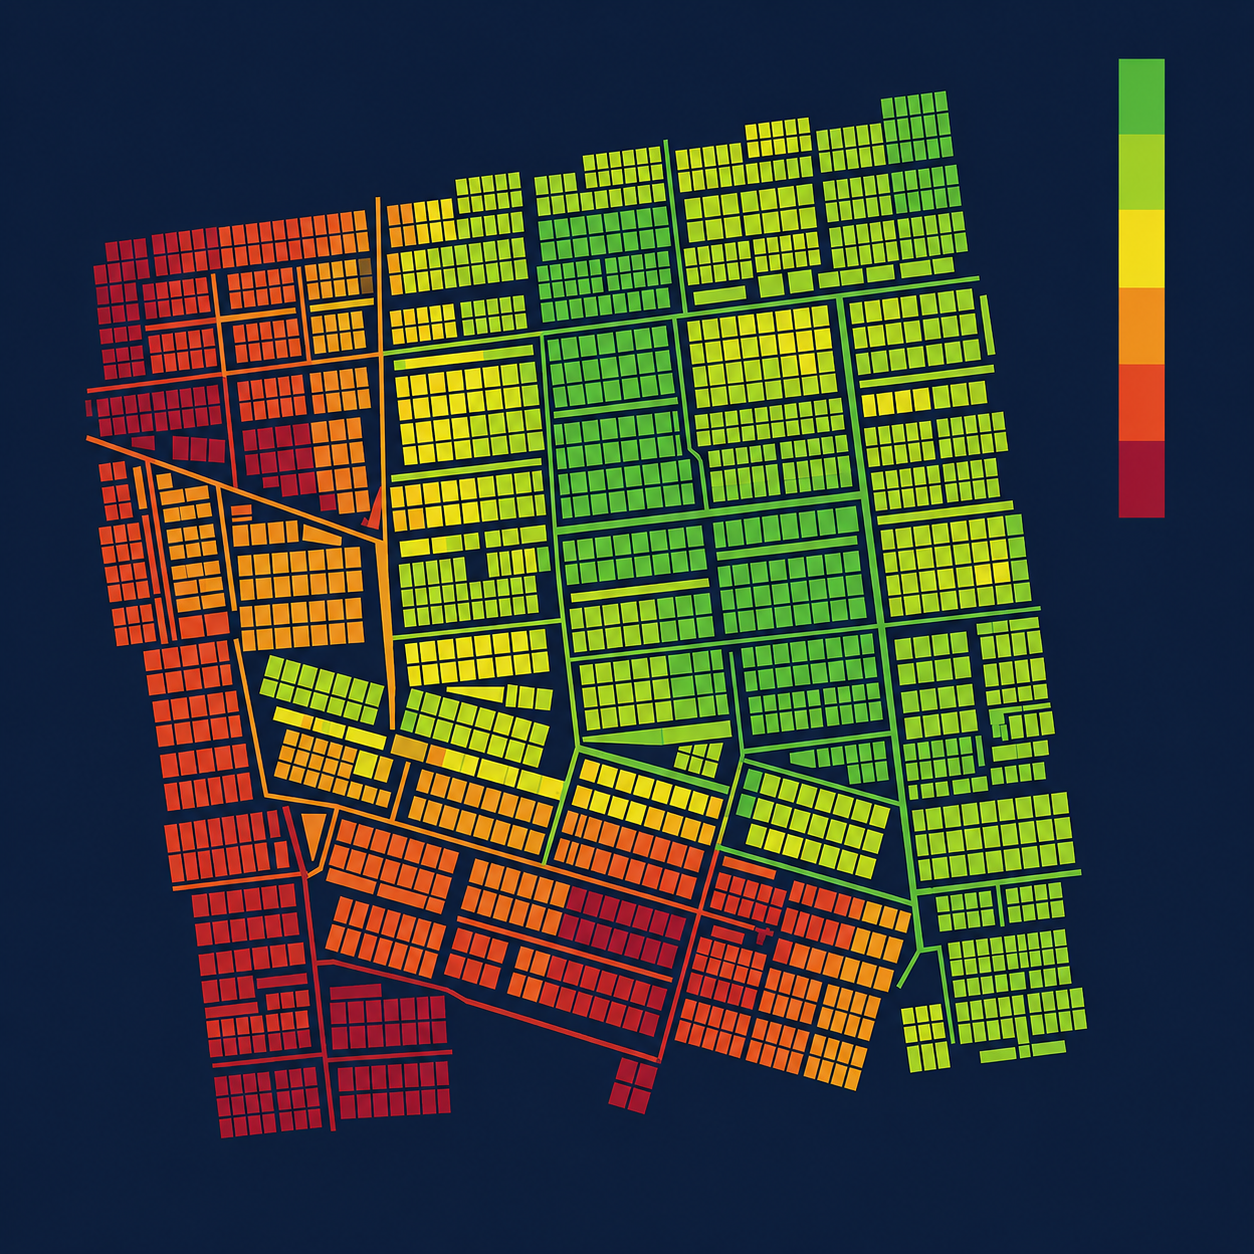
Overlay yield deviation directly onto satellite imagery to pinpoint underperformance visually.
- Identify low-performing areas instantly
- Optimise cleaning schedules and manpower allocation
- Prioritise maintenance for maximum energy recovery
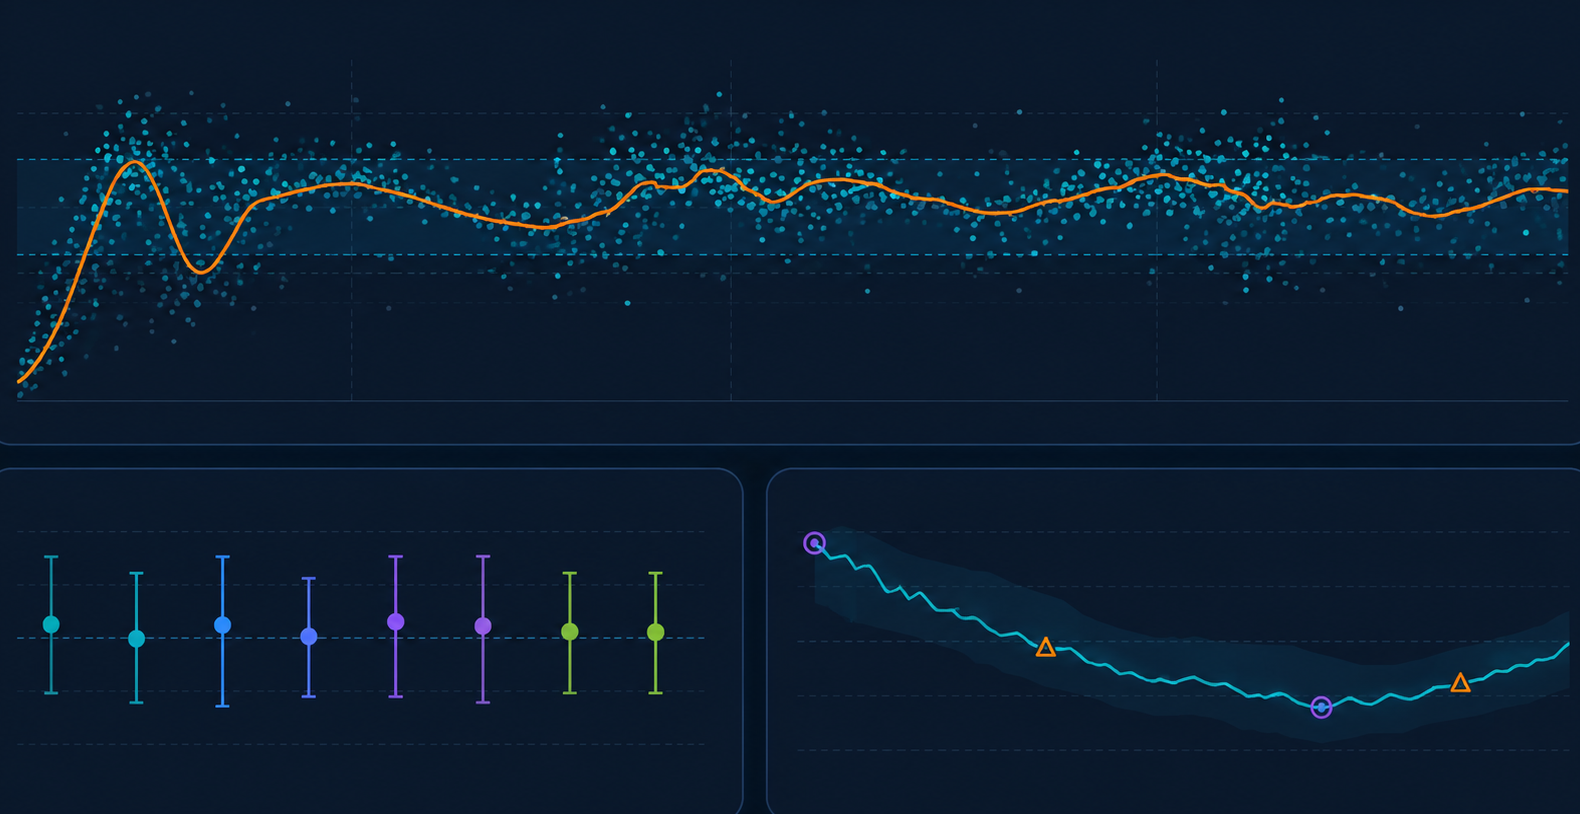
Performance Intelligence
Performance Intelligence
Automated PR evolution tracking, CoV analysis, and anomaly detection across your portfolio.
- Track monthly PR evolution across multiple sites
- Benchmark performance with coefficient of variation analysis
- Project long-term degradation trends